Wednesday, April 30, 2014

These Aftermarket Retailers Can Be Good For Your Portfolio

The do-it-for-me market is hot in the U.S and it is growing faster than the do-it-yourself market as a result of increase in older vehicles in the U.S. This aging of vehicles is creating a pent up demand for aftermarket parts and services. This is giving business opportunities to various companies.

Monro Muffler Brake (MNRO) is a popular name in the DIFM & Services segment, while Pep Boys - Manny, Moe & Jack (PBY) is a hybrid of DIFM-DIY. The present perspective seems bright for such aftermarket service providers. However, these two are entirely different from aftermarket retailers such as Advance Auto Parts (AAP). Let us take a look at the present aftermarket scenario and its prospects.

A Look at Monro Muffler

Monro Muffler came out with impressive results. The company saw strong sales, amounting to an 18% increase in net income. But as per management's estimates, the company's revenue saw a decline as a result of a weak retail environment, which negatively influenced purchasing behavior.

On the other hand, Monro was aggressive on improving its position through acquisitions. The company is focusing on expansion throughout the country, as it has recently closed the deal to buy Curry's Auto Service's ten stores and is also negotiating with seven other takeover prospects. With an aggressive expansion strategy, Monro is aiming at becoming an independent tire retailer in the U.S.

Moving deeper, Monro had acquired Ken Towery's Tire & Auto Service, Enger Auto Service & Tires, Tire King Complete Car Care, Tire Barn Warehouse of Anderson; and 17 Tuffy Muffler/Car-X locations in Wisconsin and South Carolina. With this, Monro saw geographical expansion, ultimately resulting in an increase in revenue.

As a result of acquisitions, Monro is expecting increase in sales, ranging in between $830 million to $845 million. Further, it expects EPS to come in the range of $1.58 to $1.65, which represents a 20% to 25% increase versus fiscal 2013.

Analyzing Pep Boys

Moving on to Pep Boys, its operations are based on DIFM-DIY hybrid model. Most of its revenue comes from DIFM and services. As the acquisition strategy is a growth driver to many companies, Pep Boys also acquired 17 Discount Tire Centers from AKH Company, which is expected to drive in more revenue for the company.

Moving forward, Pep Boys is working on various strategies to attract more customers. Under this, it is introducing a new store format design, intending to make it appealing to women and achieve the goal to be the best alternative to the dealer. Pep Boys is also engaged in non-automotive merchandise products such as generators, power tools and personal transportation products. This adds diversity as compared to Monro.

What about Advance Auto?

Moving on to Advance Auto, the company is seeing good business resulting from acquisitions and new store openings. The acquisition of BWP Distributors added 124 stores.

Advance Auto has become the largest aftermarket automotive provider in North America having announced acquisition of GPI. The news was so good that the company's shares took off to an all time high. After the acquisition, Advance Auto parts will be the leader in automotive aftermarket parts with over 70,000 team members and with a balanced blend of DIY, commercial and e-commerce business-to-business operations.

Conclusion

The common point that can be seen in all the three companies is that they have used acquisitions as a growth driver. However, all of them operate in different segments of the auto parts industry, giving investors three options to invest in.

Currently 0.00/512345

Rating: 0.0/5 (0 votes)

Email FeedsSubscribe via Email RSS FeedsSubscribe RSS Comments Please leave your comment:
More GuruFocus Links
Latest Guru Picks Value Strategies
Warren Buffett Portfolio Ben Graham Net-Net
Real Time Picks Buffett-Munger Screener
Aggregated Portfolio Undervalued Predictable
ETFs, Options Low P/S Companies
Insider Trends 10-Year Financials
52-Week Lows Interactive Charts
Model Portfolios DCF Calculator
RSS Feed Monthly Newsletters
The All-In-One Screener Portfolio Tracking Tool
iPhone App MORE GURUFOCUS LINKS
Latest Guru Picks Value Strategies
Warren Buffett Portfolio Ben Graham Net-Net
Real Time Picks Buffett-Munger Screener
Aggregated Portfolio Undervalued Predictable
ETFs, Options Low P/S Companies
Insider Trends 10-Year Financials
52-Week Lows Interactive Charts
Model Portfolios DCF Calculator
RSS Feed Monthly Newsletters
The All-In-One Screener Portfolio Tracking Tool
MNRO STOCK PRICE CHART 56.44 (1y: +38%) $(function(){var seriesOptions=[],yAxisOptions=[],name='MNRO',display='';Highcharts.setOptions({global:{useUTC:true}});var d=new Date();$current_day=d.getDay();if($current_day==5||$current_day==0||$current_day==6){day=4;}else{day=7;} seriesOptions[0]={id:name,animation:false,color:'#4572A7',lineWidth:1,name:name.toUpperCase()+' stock price',threshold:null,data:[[1367384400000,40.92],[1367470800000,41.24],[1367557200000,42.34],[1367816400000,41.81],[1367902800000,43.03],[1367989200000,43.27],[1368075600000,43.87],[1368162000000,44.95],[1368421200000,45.07],[1368507600000,45.96],[1368594000000,45.18],[1368680400000,44.49],[1368766800000,44.35],[1369026000000,44.11],[1369112400000,47.28],[1369198800000,48.56],[1369285200000,47.88],[1369371600000,47.65],[1369717200000,47.7],[1369803600000,47.05],[1369890000000,47.11],[1369976400000,47.02],[1370235600000,47.3],[1370322000000,47.22],[1370408400000,47.4],[1370494800000,47.5],[1370581200000,47.91],[1370840400000,48.66],[1370926800000,48.33],[1371013200000,47.46],[1371099600000,47.69],[1371186000000,47.97],[1371445200000,48.94],[1371531600000,49.73],[1371618000000,49.41],[1371704400000,48.25],[1371790800000,48.16],[1372050000000,48.14],[1372136400000,47.77],[1372222800000,47.97],[1372309200000,48.33],[1372395600000,48.05],[1372654800000,48.525],[1372741200000,49.27],[1372827600000,49.6],[1373000400000,50.01],[1373259600000,50.05],[1373346000000,50.5],[1373432400000,50.56],[1373518800000,50.05],[1373605200000,49.78],[1373864400000,50.18],[1373950800000,49.42],[1374037200000,49.18],[1374123600000,49.16],[1374210000000,48.75],[1374469200000,49.03],[1374555600000,48.44],[1374642000000,48.2],[1374728400000,44.85],[1374814800000,44.5],[1375074000000,43.32],[1375160400000,42.91],[1375246800000,43.09],[1375333200000,44],[1375419600000,43.98],[1375678800000,44.17],[1375765200000,44.46],[1375851600000,44.1],[1375938000000,44.9],[1376024400000,44.5],[1376283600000,44.89],[1376370000000,44.96],[1376456400000,44.45],[1376542800000,43.15],[1376629200000,43.04],[1376888400000,43.21],[1376974800000,43.5],[1377061200000,42.92],[1377147600000,43.32],[1377234000000,44.2],[1377493200000,44.64],[1377579600000,42.96],[1377666000000,43.71],[1377752400000,44.76],[1377838800000,44.27],[1378184400000,44.15],[137827080! 0000,44.68],[1378357200000,44.71],[1378443600000,43.89],[1378702800000,44.64],[1378789200000,44.94],[1378875600000,44.8],[1378962000000,44.38],[1379048400000,44.118],[1379307600000,44.29],[1379394000000,44.64],[1379480400000,44.89],[1379566800000,44.26],[1379653200000,43.89],[1379912400000,43.99],[1379998800000,43.35],[1380085200000,44.44],[1380171600000,45.9],[1380258000000,46.66],[1380517200000,46.43],[1380603600000,46.77],[1380690000000,46.38],[1380776400000,45.61],[1380862800000,45.96],[1381122000000,45.04],[1381208400000,44.65],[1381294800000,43.89],[1381381200000,45.22],[1381467600000,47.02],[1381726800000,46.75],[1381813200000,45.7],[1381899600000,46.71],[1381986000000,46.87],[1382072400000,47],[1382331600000,47.24],[1382418000000,47.49],[1382504400000,46.78],[1382590800000,46.77],[1382677200000,46.31],[1382936400000,45.86],[1383022800000,45.98],[1383109200000,45.4],[1383195600000,46],[1383282000000,47.428],[1383544800000,49.12],[1383631200000,48.77],[1383717600000,49.02],[1383804000000,47.66],[1383890400000,46.88],[1384149600000,46.99],[1384236000000,48.5],[1384322400000,48.34],[1384408800000,48.28],[1384495200000,49.26],[1384754400000,49.09],[1384840800000,49.8],[1384927200000,50.61],[1385013600000,51.72],[1385100000000,51.71],[1385359200000,51.09],[1385445600000,51.67],[1385532000000,52.39],[1385704800000,53.06],[1385964000000,50.91],[1386050400000,50.31],[1386136800000,49.46],[1386223200000,50.37],[1386309600000,50.73],[1386568800000,51.95],[1386655200000,51.24],[1386741600000,50.78],[1386828000000,52.12],[1386914400000,51.78],[1387173600000,52.28],[1387260000000,52.05],[1387346400000,53.37],[1387432800000,53.92],[1387519200000,54.05],[1387778400000,54.64],[1387864800000,54.88],[1388037600000,55.34],[1388124000000,54.57],[1388383200000,55.65],[1388469600000,56.36],[1388642400000,55.2],[1388728800000,55.87],[1388988000000,55.27],[1389074400000,56.73],[1389160800000,56.11],[1389247200000,56.28],[1389333600000,55.81],[1389592800000,55.23],[1389679200000,57.52],[1389765600000,56.73],[138985200000! 0,56.45],! [1389938400000,56.17],[1390284000000,56.48],[1390370400000,56.12],[1390456800000,55.66],[1390543200000,54.24],[1390802400000,55.29],[1390888800000,54.98],[1390975200000,55.48],[1391061600000,55.68],[1391148000000,55.51],[1391407200000,54.63],[1391493600000,55.17],[1391580000000,55.16],[1391666400000,56.4],[1391752800000,56.83],[1392012000000,56.17],[1392098400000,56.14],[1392184800000,54.74],[1392271200000,55.33],[1392357600000,55.25],[1392703200000,56.34],[1392789600000,56.03],[1392876000000,55.63],[1392962400000,56.63],[1393221600000,58.01],[1393308000000,58.47],[1393394400000,59.25],[1393826400000,59.23],[1393912800000,60.92],[1393999200000,61.46],[1394085600000,61.44],[1394172000000,61.81],[1394427600000,61.58],[1394514000000,60.8],[1394600400000,60.56],[1394686800000,59.74],[1394773200000,59.6],[1395032400000,60.05],[1395118800000,59.11],[1395205200000,58.35],[1395291600000,57.95],[1395378000000,59.04],[1395637200000,58.34],[1395723600000,57.19],[1395810000000,56.39],[1395896400000,56.08],[1395982800000,5

Tuesday, April 29, 2014

5 Beaten-Down Stocks to Buy

LinkedIn Logo RSS Logo James Brumley Popular Posts: This Year’s 5 Hottest Marijuana StocksDon’t Dump MCD Stock Just Yet – McDonalds Has a PlanWhat Is a Stock Split? Recent Posts: 5 Beaten-Down Stocks to Buy The Bears Should Clamp Down on Gold Prices Again … And Soon 2 Clear Signs That Biotechs and Pharmaceuticals Have Peaked View All Posts

We’re in the midst of earnings season, stuck in the shadow of a market that seems content to simply spin its wheels. At the same time, we’re standing against the backdrop of Einhorn’s theory that technology stocks are in a bubble, plagued by ongoing tensions in Ukraine.

bargain 185x185 5 Beaten Down Stocks to BuyAnd with a dozen or so other distractions bouncing around in investors’ heads right now, it would be easy to forget to remain on the hunt for bargain stocks.

So, consider this your gentle reminder … as always, remain on the hunt for bargain stocks.

And if you don’t have time to shop around, here are five of the market’s top stocks to buy. They may have been beaten down lately, but seem ready to pop back up as investors remember they still have bigger-picture value.

Stocks to Buy: iRobot (IRBT)

iRobot185 5 Beaten Down Stocks to BuyThe marketability of robots — not to mention their functionality — has quietly soared in the past couple of years. In fact, you might say that robotics technology has finally come of age. As evidence of just how far robots have come, earlier in the month, iRobot (NASDAQ:IRBT) landed another multi-million contract with the Department of Defense to supply robotics and parts to the military.

One would think this news would send IRBT stock soaring, but that’s not what happened here. iRobot shares are now below the price they were trading at when the DoD news came out. In fact, IRBT shares have fallen 25% since their early March peak.

But shareholders made a big mistake by selling. iRobot has managed to grow the top line in four of the past five years, and has turned a profit in all five of them … and that was before robots had become relatively common. Now that iRobot is something of a household word, revenues could really start to crank up, potentially pushing IRBT to the top of a list of great stocks to buy.

Stocks to Buy: Charter Communications (CHTR)

Charter Communications CHTR 185 5 Beaten Down Stocks to BuyEven though it’s the fourth-largest in the country, Charter Communications (NASDAQ:CHTR) is frequently left out of discussions of the nation’s major cable-television service providers. Perhaps the market is worried about the fact that income has been shrinking for several years despite rising revenue — a sign of worrisome long-term viability.

What investors may not realize about Charter Communications, however, is that the company has already begun converting its traditional cable-television signals to digital signals. The upgrade will improve service as well as bring new viewing options to current subscribers, and the overhaul should also lead to higher margins.

Yet, even with the 10% bounce we’ve seen from CHTR stock since last week’s lows, shares are still trading well below last year’s highs, and still have lots of room to keep rising before hitting any major headwinds. If you’re looking for stocks to buy, you could do a lot worse than CHTR.

Stocks to Buy: Waste Management (WM)

WasteManagement185 5 Beaten Down Stocks to BuyLike dividends? Waste Management (NYSE:WM) pays them – and increases them — like clockwork. And investors who wade into Waste Management now will find the yields on their investment in WM stock are a little sweeter thanks to 13% tumble the stock took between November of last year and March of this year.

Although shares of WM stock have advanced 7% from those March lows, the yield is still an attractive 3.6%. And there’s still plenty of room for the stock to reclaim the ground it lost over the past six months. Given all of that, there’s nothing trashy about this trash collector; it’s one of the market’s top stocks to buy.

Stocks to Buy: Brunswick (BC)

Brunswick Corporation BC 185 5 Beaten Down Stocks to BuyTalk about a tough crowd! Despite Brunswick (NYSE:BC) managing to top estimates in every quarter of 2011, 2012, and 2013, the recreation products company merely met estimates in Q1. As a result, BC stock sold off to the tune of 2.5% following the news, topping off what’s now become a 10% plunge from March’s highs. It looks like investors knew what was coming.

As Benjamin Graham said so well, though, “In the short run, the market is a voting machine but in the long run it is a weighing machine.” The pullback Brunswick doled out between early April and now was just a near-term vote in response to one quarter. In the long run, however, Brunswick is still the same company that has had a multi-year habit of topping estimates and growing the bottom line. One mediocre quarter doesn’t change that, and Brunswick is still one of the top stocks to buy.

Stocks to Buy: Bally Technologies (BYI)

BallysTechnologies185a 5 Beaten Down Stocks to BuyThe casino and gaming industry may be struggling, but that doesn’t mean every company that equips casinos is in the same dire straits. Bally Technologies (NYSE:BYI), for instance, is on pace to grow per-share income by 27% in the current fiscal year (ending in June), and analysts believe it will improve profits per share to the tune of 15% next fiscal year.

That’s not too shabby, and the pot’s made even sweeter by the fact that BYI stock is only trading at a forward-looking P/E of 12.6, thanks to the 23% tumble from its mid-January highs.

The pullback likely began as a preemptive strike in front of February’s earnings results, which were mediocre at best. Jannay Capital downgraded BYI stock just a few days later, followed swiftly by a downgrade from Goldman Sachs in March. However, the sellers may have overshot with the stock. Bally Technologies is still in a solid growth trend, and there’s a reason Stifel made a point of saying earlier in the month that the dip was a long-term buying opportunity — BYI really is one of the better stocks to buy at this point.

As of this writing, James Brumley did not hold a position in any of the aforementioned securities.

Monday, April 28, 2014

Should You Own Pfizer Stock?

With shares of Pfizer (NYSE:PFE) trading around $28.72, is PFE an OUTPERFORM, WAIT AND SEE or STAY AWAY? Let's analyze the stock with the relevant sections of our CHEAT SHEET investing framework:

T = Trends for a Stock’s Movement

Pfizer is a biopharmaceutical company that discovers, develops, manufactures, and sells medicines for people and animals worldwide. The company manages its operations through five segments: Primary Care; Specialty Care and Oncology; Established Products and Emerging Markets; Animal Health and Consumer Healthcare, and Nutrition. Pfizer’s main products include human and animal biologic and small molecule medicines and vaccines, nutritional products, consumer healthcare products, and products for the prevention and treatment of diseases in livestock and companion animals. Illness and disease is something that plagues people and animals around the world. Pfizer is in constant battle trying to improve its products in order to help people and animal struggling around the world. So long as health is a main concern for people and animals, Pfizer stands to see significant profits for years to come.

T = Technicals on the Stock Chart are Mixed

Pfizer stock has seen an explosive move higher over the last several years. The stock has reversed its long-term trend from down to up and sees no signs of slowing. Analyzing the price trend and its strength can be done using key simple moving averages. What are the key moving averages? The 50-day (pink), 100-day (blue), and 200-day (yellow) simple moving averages. As seen in the daily price chart below, Pfizer is trading around its rising key averages which signal neutral price action in the near-term.

PFE

(Source: Thinkorswim)

Taking a look at the implied volatility (red) and implied volatility skew levels of Pfizer options may help determine if investors are bullish, neutral, or bearish.

NEW! Discover a new stock idea each week for less than the cost of 1 trade. CLICK HERE for your Weekly Stock Cheat Sheets NOW!

Implied Volatility (IV)

30-Day IV Percentile

90-Day IV Percentile

Pfizer Options

18.76%

10%

11%

What does this mean? This means that investors or traders are buying a small amount of call and put options contracts, as compared to the last 30 and 90 trading days.

Put IV Skew

Call IV Skew

June Options

Steep

Average

July Options

Steep

Average

As of today, there is an average demand from call buyers or sellers and high demand by put buyers or low demand by put sellers, all neutral to bearish over the next two months. To summarize, investors are buying a small amount of call and put option contracts and are leaning neutral to bearish over the next two months.

Top Food Companies To Buy Right Now

On the next page, let’s take a look at the earnings and revenue growth rates and the conclusion.

E = Earnings Are Decreasing Quarter-Over-Quarter

Rising stock prices are often strongly correlated with rising earnings and revenue growth rates. Also, the last four quarterly earnings announcement reactions help gauge investor sentiment on Pfizer’s stock. What do the last four quarterly earnings and revenue growth (Y-O-Y) figures for Pfizer look like and more importantly, how did the markets like these numbers?

2013 Q1

2012 Q4

2012 Q3

2012 Q2

Earnings Growth (Y-O-Y)

58.33%

358%

-10.42%

30.30%

Revenue Growth (Y-O-Y)

-12.37%

-6.65%

-15.85%

-8.66%

Earnings Reaction

-4.46%

3.2%

-1.28%

1.39%

Pfizer has seen increasing earnings and revenue figures over most of the last four quarters. From these figures, the markets have had mixed feelings about Pfizer’s recent earnings announcements.

P = Average Relative Performance Versus Peers and Sector

How has Pfizer stock done relative to its peers, Merck (NYSE:MRK), Novartis (NYSE:NVS), Sanofi (NYSE:SNY), and sector?

Pfizer

Merck

Novartis

Sanofi

Sector

Year-to-Date Return

14.66%

10.60%

18.59%

15.60%

15.91%

Pfizer has been an average performer, year-to-date.

NEW! Discover a new stock idea each week for less than the cost of 1 trade. CLICK HERE for your Weekly Stock Cheat Sheets NOW!

Conclusion

Pfizer provides valuable products for the health, wellness, and support of people and animals living in a multitude of countries around the world. The stock has been a strong performer in recent years and looks to have a strong uptrend intact. Earnings and revenue figures have been decreasing a bit, over the last four quarters, which has sent mixed signals to investors. Relative to its strong peers and sector, Pfizer has been an average year-to-date performer. WAIT AND SEE what Pfizer does this coming quarter.

Sunday, April 27, 2014

This Is How Nokia Will Help Microsoft

After dragging on for nearly half a year, tech giant Microsoft (MSFT) and Finnish mobile maker Nokia (NOK) finalized their merger. On Friday, April 25, Microsoft announced that it had completed its acquisition of Nokia, including hardware and services. The deal, originally set to be a $7.2 acquisition of all of Nokia's assets, may not have gone as planned, but it was a definite step-up from the waiting game investors were being subjected to.The specifications of the deal

The merger between the two companies had been in the works since September, but hit many a bump on the road. The two major obstacles in the path were the Chinese regulations and the ongoing tax investigation regarding Nokia's Indian plant, operating in Chennai. While China green-lighted the deal easily, the Indian authorities were less obliging. The end result is that the Indian facility was not a part of the acquisitions and will be retained by Nokia. Although Nokia has not announced any conclusive plans, the fact that it offered its 7500+ Indian workers early retirement scheme suggests that the plant may soon be shut down. Also, noticeably absent from the terms of the merger was the "state of the art" South Korean plant in Masan. The deal closed for $7.5 billion. As previously decided, Nokia's former CEO Stephen Elop will be reporting to Microsoft CEO, Satya Nadella and will be appointed executive vice president of Microsoft Devices Group. He will be overseeing the division that, from hence on, will be in charge of expanding the business of Lumia smartphones and tablets, Xbox hardware, Perceptive Pixel (PPI) products and accessories. Microsoft also plans to export more than 25,000 of Nokia's former 90,000 employees.What does it mean for Microsoft's future?

According to a 2013 IDC report, Windows OS holds a 3.3% share in the smartphone market, compared to Google Android's (GOOG) 78.6% and Apple's (AAPL) 15.2%. However, now that this latest acquisition puts the company in charge of its own hardware and software, analysts presume this may change. Like Apple, Microsoft will now have exclusive rights over its devices, software as well as online presence, giving it an advantageous opportunity to further its position. Windows boasts of the fastest growing smartphone market, as well as the fastest growing platform with a 91% YoY gain. The company has continuously turned out award winning devices and has firmly carved its niche in the smart phone world. An IDC report of the fourth quarter of 2013 puts it among the top three smart phone makers of the world. Furthermore, continuing the trend of the Nokia mobile phone business, Microsoft plans to target the mid to lower end of the consumer spectrum in its range of affordable phones. This provides an opportunity of a $50 billion market annually.Concluding thoughts

The company has assured users of delivering new and improved products, and it will work closely with a plethora of hardware partners, operators, developers and retailers, providing platforms, applications and services that enable them to create outstanding devices. With hardware and software falling under the same network, the company has proclaimed that it will achieve an edge over its competitors. The windows phone now seeks to create an integrated ecosystem that will strengthen the platform and enable the growth of demand for Windows devices overall. In such an enticing scenario, many are optimistic that the Windows Phone may prove to be the device that finally challenges Samsung and Apple's hold over the market.

Currently 4.00/512345

Rating: 4.0/5 (1 vote)

Voters:
Email FeedsSubscribe via Email RSS FeedsSubscribe RSS Comments Please leave your comment:
More GuruFocus Links
Latest Guru Picks Value Strategies
Warren Buffett Portfolio Ben Graham Net-Net
Real Time Picks Buffett-Munger Screener
Aggregated Portfolio Undervalued Predictable
ETFs, Options Low P/S Companies
Insider Trends 10-Year Financials
52-Week Lows Interactive Charts
Model Portfolios DCF Calculator
RSS Feed Monthly Newsletters
The All-In-One Screener Portfolio Tracking Tool
iPhone App MORE GURUFOCUS LINKS
Latest Guru Picks Value Strategies
Warren Buffett Portfolio Ben Graham Net-Net
Real Time Picks Buffett-Munger Screener
Aggregated Portfolio Undervalued Predictable
ETFs, Options Low P/S Companies
Insider Trends 10-Year Financials
52-Week Lows Interactive Charts
Model Portfolios DCF Calculator
RSS Feed Monthly Newsletters
The All-In-One Screener Portfolio Tracking Tool
MSFT STOCK PRICE CHART 39.91 (1y: +22%) $(function(){var seriesOptions=[],yAxisOptions=[],name='MSFT',display='';Highcharts.setOptions({global:{useUTC:true}});var d=new Date();$current_day=d.getDay();if($current_day==5||$current_day==0||$current_day==6){day=4;}else{day=7;} seriesOptions[0]={id:name,animation:false,color:'#4572A7',lineWidth:1,name:name.toUpperCase()+' stock price',threshold:null,data:[[1367211600000,32.61],[1367298000000,33.1],[1367384400000,32.72],[1367470800000,33.16],[1367557200000,33.49],[1367816400000,33.75],[1367902800000,33.31],[1367989200000,32.99],[1368075600000,32.66],[1368162000000,32.69],[1368421200000,33.03],[1368507600000,33.53],[1368594000000,33.845],[1368680400000,34.08],[1368766800000,34.87],[1369026000000,35.08],[1369112400000,34.85],[1369198800000,34.61],[1369285200000,34.15],[1369371600000,34.269],[1369717200000,35.02],[1369803600000,34.88],[1369890000000,35.03],[1369976400000,34.9],[1370235600000,35.59],[1370322000000,34.99],[1370408400000,34.78],[1370494800000,34.96],[1370581200000,35.67],[1370840400000,35.47],[1370926800000,34.84],[1371013200000,35],[1371099600000,34.715],[1371186000000,34.4],[1371445200000,35],[1371531600000,34.98],[1371618000000,34.59],[1371704400000,33.49],[1371790800000,33.265],[1372050000000,33.715],[1372136400000,33.67],[1372222800000,34.35],[1372309200000,34.62],[1372395600000,34.545],[1372654800000,34.36],[1372741200000,33.94],[1372827600000,34.01],[1373000400000,34.21],[1373259600000,34.325],[1373346000000,34.35],[1373432400000,34.7],[1373518800000,35.685],[1373605200000,35.67],[1373864400000,36.17],[1373950800000,36.27],[1374037200000,35.74],[1374123600000,35.44],[1374210000000,31.4],[1374469200000,32.01],[1374555600000,31.82],[1374642000000,31.96],[1374728400000,31.39],[1374814800000,31.62],[1375074000000,31.54],[1375160400000,31.85],[1375246800000,31.84],[1375333200000,31.67],[1375419600000,31.89],[1375678800000,31.7],[1375765200000,31.58],[1375851600000,32.063],[1375938000000,32.89],[1376024400000,32.7],[1376283600000,32.87],[1376370000000,32.23],[1376456400000,32.35],[1376542800000,31.79],[1376629200000,31.8],[1376888400000,31.393],[1376974800000,31.62],[1377061200000,31.61],[1377147600000,32.39],[1377234000000,34.75],[1377493200000,34.15],[1377579600000,33.26],[1377666000000,33.02],[1377752400000,33.55]! ,[1377838800000,33.4],[1378184400000,31.88],[1378270800000,31.195],[1378357200000,31.235],[1378443600000,31.152],[1378702800000,31.655],[1378789200000,32.39],[1378875600000,32.74],[1378962000000,32.69],[1379048400000,33.03],[1379307600000,32.801],[1379394000000,32.93],[1379480400000,33.32],[1379566800000,33.64],[1379653200000,32.791],[1379912400000,32.74],[1379998800000,32.455],[1380085200000,32.505],[1380171600000,32.77],[1380258000000,33.27],[1380517200000,33.28],[1380603600000,33.58],[1380690000000,33.92],[1380776400000,33.86],[1380862800000,33.88],[1381122000000,33.3],[1381208400000,33.01],[1381294800000,33.07],[1381381200000,33.76],[1381467600000,34.13],[1381726800000,34.45],[1381813200000,34.49],[1381899600000,34.64],[1381986000000,34.92],[1382072400000,34.96],[1382331600000,34.99],[1382418000000,34.58],[1382504400000,33.76],[1382590800000,33.72],[1382677200000,35.73],[1382936400000,35.57],[1383022800000,35.52],[1383109200000,35.54],[1383195600000,35.405],[1383282000000,35.525],[1383544800000,35.94],[1383631200000,36.64],[1383717600000,38.18],[1383804000000,37.5],[1383890400000,37.78],[1384149600000,37.59],[1384236000000,37.36],[1384322400000,38.155],[1384408800000,38.021],[1384495200000,37.841],[1384754400000,37.2],[1384840800000,36.74],[1384927200000,37.08],[1385013600000,37.4],[1385100000000,37.57],[1385359200000,37.64],[1385445600000,37.35],[1385532000000,37.6],[1385704800000,38.13],[1385964000000,38.45],[1386050400000,38.31],[1386136800000,38.94],[1386223200000,38],[1386309600000,38.36],[1386568800000,38.705],[1386655200000,38.11],[1386741600000,37.61],[1386828000000,37.22],[1386914400000,36.69],[1387173600000,36.885],[1387260000000,36.52],[1387346400000,36.58],[1387432800000,36.25],[1387519200000,36.8],[1387778400000,36.62],[1387864800000,37.08],[1388037600000,37.44],[1388124000000,37.29],[1388383200000,37.29],[1388469600000,37.41],[1388642400000,37.16],[1388728800000,36.91],[1388988000000,36.13],[1389074400000,36.41],[1389160800000,35.76],[1389247200000,35.53],[1389333600000,36.04],[1389592! 800000,34! .98],[1389679200000,35.78],[1389765600000,36.76],[1389852000000,36.89],[1389938400000,36.38],[1390284000000,36.17],[1390370400000,35.93],[1390456800000,36.055],[1390543200000,36.805],[1390802400000,36.03],[1390888800000,36.27],[1390975200000,36.66],[1391061600000,36.86],[1391148000000,37.84],[1391407200000,36.48],[1391493600000,36.35],[1391580000000,35.82],[1391666400000,36.18],[1391752800000,36.56],[1392012000000,36.8],[1392098400000,37.175],[1392184800000,37.47],[1392271200000,37.61],[1392357600000,37.62],[1392703200000,37.42],[1392789600000,37.51],[1392876000000,37.75],[1392962400000,37.98],[1393221600000,37.69],[1393308000000,37.54],[1393394400000,37.47],[1393826400000,37.78],[1393912800000,38.41],[13939992000

Friday, April 25, 2014

The Opportunities of Geopolitical Conflict

Print Friendly

So far, 2014 has been a year of heightened geopolitical risk. Russia has annexed the Crimea region of Ukraine, Syria remains embroiled in a civil war, political protests continue in Egypt and Turkey, and North Korea has once again fired missiles into the sea to protest joint US-South Korea military exercises.

Earlier this month, the managing director of the International Monetary Fund, Christine Lagarde, pointed to these simmering geopolitical tensions as an impediment to global economic growth.

Geopolitical risk can affect a variety of asset classes, ranging from energy and gold to bonds and equities. In the energy space, Brent crude, essentially the equivalent of West Texas Intermediate (WTI), traded above $109 a barrel thanks to worries that Russia might make a play for more Ukrainian territory. While WTI also spiked, it finished the week essentially flat following a stronger than expected inventory report from the Energy Information Administration (EIA).

Even as oil prices are on the rise, so is production. In the US, the EIA reports that crude production average 7.5 million barrels per day (BPD) last year, 1 million BPD over 2012 and the highest annual rate since 1989. The agency estimates that production should run about 8.5 million BPD this year and hit 9.6 million BPD next year, the highest level of production since 1970.

The Organization of Petroleum Exporting Countries (OPEC), which produces about 40 percent of the world's oil, is forecasting similar supply growth. This past January production rose by 28,000 BPD to 29.71 million BPD, largely thanks to increased production from Libya. Including America's production increase, non-OPEC countries are expected to boost their supply by 1.29 million BPD to 55.43 million BPD.

With consumption forecast to grow by about 1.3 million BPD in 2014, that leaves supply and demand in almost perfect balance, supporting strong oil prices eve! n when and if the crisis in Ukraine abates.

Not only does that make energy stocks a compelling investment theme for the remainder of this year, given the impact of geopolitics on energy prices it also makes them an ideal hedge against instability. Energy stocks also happen to be one of the best bargains in the market right now.

According to data from FactSet, of the energy stocks included in the S&P 500 that have reported first quarter earnings so far, 75 percent have reported revenue that’s above estimates. That makes energy the best performing sector in terms of revenue beats in the quarter. On the other hand, the energy and financials sectors have reported the biggest decline in earnings as a result of higher operating expenses and lower production volumes.

That said, largely because of higher prices, analysts expect the energy sector to swing to double-digit profit growth in the remaining three quarters of 2014 and into 2015, making the sector an attractive bargain following the recent weakness.

There are a couple of ways to play the global energy sector in your portfolio.

The first is to focus on individual names, such as China Petroleum & Chemical Corp (NYSE: SNP), otherwise known as Sinopec.

While China's economic growth has been slowing over the past several quarters, energy consumption in the country has been growing. China accounted for one-third of the world's oil consumption growth last year, making the country the world's largest net importer of oil. By 2015, while China is expected to produce about 4.3 million barrels of oil per day, it will consume nearly 12 million.

That creates huge growth opportunities for Sinopec, an integrated oil company, which produces about 1.5 million barrels of oil equivalent per day with refining capability for about 5 million. At the same time, the Chinese government has introduced a more market-based pricing mechanism that allows Sinopec to reap higher profits on its refined products.
However,! Sinopec isn't a perfect hedge against geopolitical instability and its impact on oil prices. The company must import about 80 percent of the crude it uses so, while it can now pass on more of higher crude costs than it could in the past, it still has some degree of price exposure. Still, it's a great bet on growing global energy consumption.

China Petroleum & Chemical is a buy up to 120.

A less risky way to employ an energy hedge in your portfolio is with an exchange-traded fund (ETF) such as iShares Global Energy (NYSE: IXC).

This ETF holds positions in 93 companies and integrated oil and gas companies account for about half of assets, followed by exploration and production companies at a quarter of assets and equipment and services, pipelines and refiners all at less than 10 percent. With the exception of Exxon Mobil (NYSE: XOM) at 14.9 percent of assets, none of the remaining 92 companies in the portfolio account for more than 8 percent of assets.

In geographical terms, 53.2 percent of the ETF’s assets are devoted to the US. While that is a sizable chunk, the fund also offers exposure to companies based in the United Kingdom, Canada, France, China, Australia and Brazil. And given the global nature of the energy business, even companies based in the US have limited exposure to the country.

The S&P 500 is only up 1.5 percent so far this year and the Dow is essentially flat, but iShares Global Energy has gained nearly 6 percent while most emerging market indexes are off by about 1.5 percent.

Additionally, the fund has a low 0.48 percent expense ratio, making it one of the cheapest global energy funds available. It also currently offers a 2.5 percent yield with a steadily growing semiannual payout.

Another compelling characteristic is that during the global turmoil sparked off the financial crisis, the ETF was less volatile than either the S&P 500 or the MSCI Emerging Markets Index, largely thanks to steady global energy demand.
Offeri! ng an effective downside hedge against geopolitical risk, iShares Global Energy is a buy under 50.

Thursday, April 24, 2014

UnitedHealth Scores on Earnings to Carry the Dow to Another Record

We're at new record highs across the market as the Dow Jones Industrial Average (DJINDICES: ^DJI  ) and the S&P 500 (SNPINDEX: ^GSPC  ) both hit new intraday highs in today's earnings-fueled rise. The Dow's up more than 80 points as of 2:20 p.m. EDT, with UnitedHealth's (NYSE: UNH  ) jump giving a big boost to the index and countering the losses of a few other blue-chip stocks that couldn't beat the Street's earnings estimates. Let's catch up on the earnings stories making waves on the Dow today.

UnitedHealth lifts the Dow
UnitedHealth has dominated the board today, with shares gaining 6.8%. The company easily beat earnings estimates with net income that grew by more than 7% and sales that rocketed 12% higher. UnitedHealth was already the largest publicly traded health insurer before this most recent quarter, but the company has still managed to accelerate the growth in its membership -- a pivotal factor in an industry where bigger is better.

The firm's purchase of Brazilian health insurer Amil Participacoes for nearly $5 billion last year injected a jolt of adrenaline into UnitedHealth's international membership by bringing in almost 5 million new members. Additionally, the company's partnership with the Department of Defense to manage military family insurance -- which the Pentagon says UnitedHealth has handled poorly -- helped bring in another 3 million members for the quarter.

Like the rest of the industry, UnitedHealth will face a great deal of change next year as Obamacare comes into effect. However, between its overseas profile and its size, this may be the best-placed firm to handle the change. UnitedHealth's leadership expressed "strongly positive" sentiments about future growth despite health care reform, and the company raised the low end of its full-year 2013 earnings forecast as well.

UnitedHealth has outshined two other Dow components that just delivered their quarterly results. Intel's (NASDAQ: INTC  ) shares have fallen 3.7% today to lead the Dow lower after the company revealed that its earnings fell 29% in  the most recent quarter. The release also marked Intel's fourth straight quarter of sales contraction, largely brought on by the continued demise of the PC market. The semiconductor maker's PC chip sales fell 7.5% -- a troubling sign, given Intel's reliance on PC chip sales for the bulk of its revenue.

Intel cut back its full-year outlook as well. The company has looked to pivot away from the PC market recently with its forays into Internet television as well as mobile, the latter of which it finally broke into with a deal with major mobile-maker Samsung. If Intel can carve out a niche in mobile, it will go a long way toward reassuring investors that the fall in PC sales can be overcome. It'll be a long process, however: As with any stock, the big picture is what counts. Don't expect Intel to turn around rapidly.

American Express (NYSE: AXP  ) shares are also on a downswing after the company's earnings report, with the stock falling 3.2%. Despite growing consumer confidence in the U.S. -- a trend that helped the company's earnings rise 4.9% to beat Wall Street expectations -- American Express' sales growth of 3.5% failed to best analyst projections.

5 Best Quality Stocks To Own Right Now

Unlike Intel's miss, however, this earnings whiff isn't cause for concern. Investors have fretted over a European regulatory proposal that could cap credit card and debit card fees, but AmEx attempted to delay the damage today by saying that the proposed cap wouldn't affect traditional cards issued by the company. In the long term, AmEx looks to be on solid ground despite the concerns over Europe and the revenue miss. So long as the U.S. economy keeps rising and consumers feel confident about its direction, this company won't be missing analyst estimates for long.

The international edge
UnitedHealth's overseas expansion helped its big boom today, but is international exposure the way to go for investors? Global economies are slowly recovering from the recession, but there's no need to search around the world for stocks: Investing internationally is as easy as finding the U.S.' best companies. The Motley Fool's free report "3 American Companies Set to Dominate the World" shows you how. Click here to get your free copy before it's gone.

Wednesday, April 23, 2014

Why CarMax Will Keep Zooming

Based on the aggregated intelligence of 180,000-plus investors participating in Motley Fool CAPS, the Fool's free investing community, used-vehicle retailer CarMax (NYSE: KMX  ) has earned a respected four-star ranking.

With that in mind, let's take a closer look at CarMax and see what CAPS investors are saying about the stock right now.

CarMax facts

Headquarters (Founded)

Richmond, Va. (1993)

Market Cap

$10.8 billion

Industry

Automotive retail

Trailing-12-Month Revenue

$11.8 billion

Management

CEO Thomas Folliard (since 2006)
CFO Thomas Reedy (since 2010)

Return on Equity (Average, Past 3 Years)

16.5%

Cash/Debt

$725.3 million / $6.7 billion

Competitors

AutoNation (NYSE: AN  )
Penske Automotive Group (NYSE: PAG  )

Sources: S&P Capital IQ and Motley Fool CAPS.

On CAPS, 91% of the 1,041 members who have rated CarMax believe the stock will outperform the S&P 500 going forward.   

Earlier this week, one of those Fools, TMFTailwind, succinctly summed up the CarMax bull case for our community:

This big-box retailer of used cars is the market leader in a very fragmented industry, currently commanding only about a 3% market share. KMX clearly differentiates itself from its competitors (think stereotypical used-car salesmen) with its no-haggle, low-pressure sales approach and nationwide network of stores and available cars. I believe KMX has a tremendous opportunity to continue to build new stores in underserved markets and thus capture incremental market share. Scale, customer satisfaction, and value proposition are all reasons why KMX has a good chance at achieving market-beating returns.  

If you want market-thumping returns, you need to put together the best portfolio you can. Of course, despite a strong four-star rating, CarMax may not be your top choice.

With the American markets reaching new highs, investors and pundits alike are skeptical about future growth. They shouldn't be. Many global regions are still stuck in neutral, and their resurgence could result in windfall profits for select companies. A recent Motley Fool report, "3 Strong Buys for a Global Economic Recovery," outlines three companies that could take off when the global economy gains steam. Click here to read the full report!

Tuesday, April 22, 2014

5 Stocks Under $10 Ready to Explode

DELAFIELD, Wis. (Stockpickr) -- There isn't a day that goes by on Wall Street when certain stocks trading for $10 a share or less don't experience massive spikes higher. Traders savvy enough to follow the low-priced names and trade them with discipline and sound risk management are banking ridiculous coin on a regular basis.

>>5 Stocks Insiders Love Right Now

Just take a look at some of the hot movers in the under-$10 complex from Thursday, including BioFuel Energy (BIOF), which is ripping higher by 33%; LiveDeal (LIVE), which is soaring higher by 27%; SGOCO Group (SGOC), which is jumping to the upside by 17%; and GenVec (GNVC), which is moving higher by 7%. You don't even have to catch the entire move in lower-priced stocks such as these to make outsized returns when trading.

One low-priced stock that recently made a huge run after I featured it was technology solutions player Rambus (RMBS), which I highlighted in Feb. 20's "5 Stocks Under $10 Ready to Explode" at $1.27 per share. I mentioned in that piece that shares of Rambus of were starting to spike higher off its 50-day moving average at that time of $9.12 a share. That spike was beginning to push shares of RMBS within range of triggering a near-term breakout trade above some key overhead resistance levels at $9.73 to $9.81 a share.

Guess what happened? Shares of RMBS didn't wait long to trigger that breakout, since the stock busted out above those levels a few weeks later. This stock has gone on to make an incredible move higher even during the recent market decline, with shares of RMBS tagging an intraday high today of $12.50 a share. That represents a massive gain of well over 30% from the time I featured this stock. The best part about this move is the clean uptrend you'll see on the chart for RMBS as the stock marched higher over the last few months.

Low-priced stocks are something that I tweet about on a regular basis. I frequently flag high-probability setups, breakout candidates and low-priced stocks that are acting technically bullish. I like to hunt for low-priced stocks that are showing bullish price and volume trends, since that increases the probability of those stocks heading higher. These setups often produce monster moves higher in very short time frames.

>>5 Stocks Set to Soar on Bullish Earnings

When I trade under-$10 names, I do it almost entirely based off of the charts and technical analysis. I also like to find under-$10 names with a catalyst, but that's secondary to the chart and volume patterns.

With that in mind, here's a look at several under-$10 stocks that look poised to potentially trade higher from current levels.

FuelCell Energy


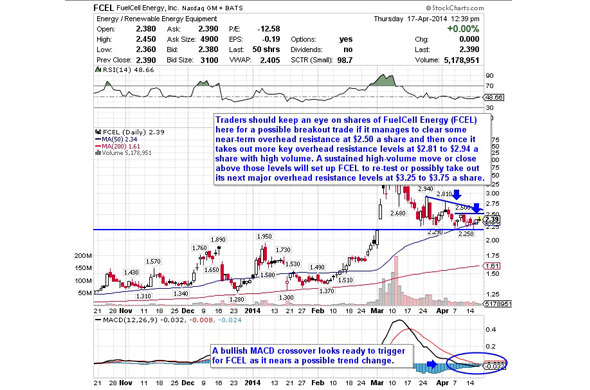
One under-$10 alternative energy player that's starting to move within range of triggering a big breakout trade is FuelCell Energy (FCEL), which designs, manufactures, sells, installs, operates and services stationary fuel cell power plants for distributed baseload power generation. This stock is off to a monster start so far in 2014, with shares up a whopping 70%.

If you take a glance at the chart for FuelCell Energy, you'll notice that this stock has pulled back sharply over the last month and change, with shares falling from its high of $4.74 to its recent low of $2.25 a share. During that downtrend, shares of FCEL have been consistently making lower highs and lower lows, which is bearish technical price action. That said, shares of FCEL have formed a double bottom chart pattern at $2.29 to $2.25 a share over the last few weeks right above its 50-day moving average. Shares of FCEL are now starting to uptick a bit and trend within range of triggering a big breakout trade.

Traders should now look for long-biased trades in FCEL if it manages to break out above some near-term overhead resistance at $2.50 a share and then once it takes out more key overhead resistance levels at $2.81 to $2.94 a share with high volume. Look for a sustained move or close above those levels with volume that hits near or above its three-month average action of 24.26 million shares. If that breakout triggers soon, then FCEL will set up to re-test or possibly take out its next major overhead resistance levels at $3.25 to $3.75 a share.

Traders can look to buy FCEL off weakness to anticipate that breakout and simply use a stop that sits right below those double bottom support levels at $2.29 to $2.25 a share or right around $2 a share. One can also buy FCEL off strength once it starts to take out those breakout levels with volume and then simply use a stop that sits a comfortable percentage from your entry point.

Plug Power


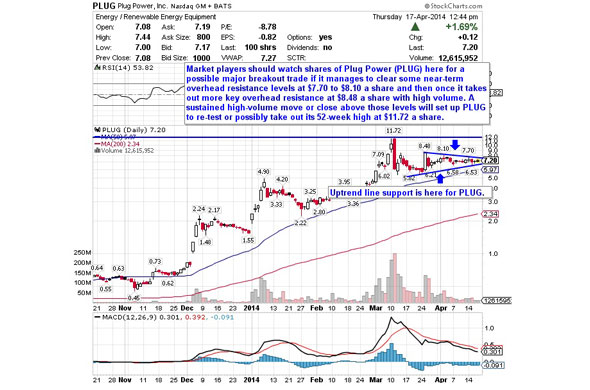
Another under-$10 alternative energy player that's starting to trend within range of hitting a big breakout trade is Plug Power (PLUG), which is engaged in the design, development, manufacture and commercialization of fuel cell systems for the industrial off-road markets worldwide. This stock has been an absolute favorite play for the bulls in 2014, with shares up a whopping 368%.

If you take a look at the chart for Plug Power, you'll notice that this stock has been trending sideways and consolidating over the last month, with shares moving between $6.21 on the downside and $8.48 on the upside. That sideways trend has been occurring right above PLUG's 50-day moving average that's currently at $5.97 a share. Shares of PLUG are now starting spike higher and trend within range of triggering a big breakout trade above the upper-end of its recent sideways trading chart pattern.

Market players should now look for long-biased trades in PLUG if it manages to break out above some near-term overhead resistance levels at $7.70 to $8.10 a share and then once it takes out more key overhead resistance at $8.48 a share with high volume. Look for a sustained move or close above those levels with volume that hits near or above its three-month average action of 43.84 million shares. If that breakout materializes soon, then PLUG will set up to re-test or possibly take out its 52-week high at $11.72 a share.

Traders can look to buy PLUG off weakness to anticipate that breakout and simply use a stop that sits right below some key near-term support at $6.53 a share or right below its 50-day moving average of $5.97 a share. One can also buy PLUG off strength once it starts to take out those breakout levels with volume and then simply use a stop that sits a comfortable percentage from your entry point.

Capstone Turbine


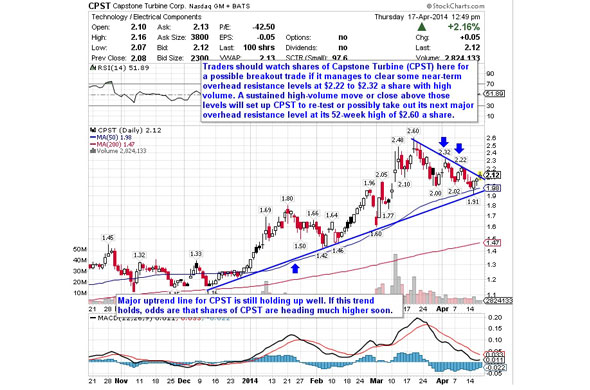
One under-$10 industrial electric equipment player that's starting to move within range of triggering a near-term breakout trade is Capstone Turbine (CPST), which engages in developing, manufacturing, marketing and servicing microturbine technology solutions for use in stationary distributed power generation applications worldwide. This stock is off to a hot start in 2014, with shares up sharply by 65%.

If you consult the chart for Capstone Turbine, you'll see that this stock recently pulled back off its 52-week high at $2.60 to its recent low of $1.91 a share. That low took shares of CPST right below its 50-day moving average and the stock has subsequently started to bounce higher back above that key technical level. Shares of CPST are now starting to uptick and move within range of triggering a near-term breakout trade.

Traders should now look for long-biased trades in CPST if it manages to break out above some near-term overhead resistance levels at $2.22 to $2.32 a share with high volume. Look for a sustained move or close above those levels with volume that hits near or above its three-month average volume of 7.72 million shares. If that breakout gets underway soon, then CPST will set up to re-test or possibly take out its next major overhead resistance level at its 52-week high of $2.60 a share.

Traders can look to buy CPST off weakness to anticipate that breakout and simply use a stop that sits right below that recent low of $1.91 a share. One can also buy CPST off strength once it starts to smash above those key resistance levels with volume and then simply use a stop that sits a comfortable percentage from your entry point.

Harvest Natural Resources


Another under-$10 independent energy player that's starting to push within range of triggering a big breakout trade is Harvest Natural Resources (HNR), which engages in the acquisition, exploration, development, production and disposition of oil and natural gas properties. This stock has been hit by the sellers over the last six months, with shares off by 15.6%.

If you take a glance at the chart for Harvest Natural Resources, you'll notice this stock has just started to trend back above both its 50-day and 200-day moving averages, which is bullish technical price action. That trend is quickly starting to push shares of HNR within range of triggering a big breakout trade above some key near-term overhead resistance levels.

Market players should now look for long-biased trades in HNR if it manages to break out above some key near-term overhead resistance levels at $4.75 to $5 a share with high volume. Look for a sustained move or close above those levels with volume that hits near or above its three-month average action of 312,623 shares. If that breakout starts soon, then HNR will set up to re-test or possibly take out its next major overhead resistance levels $5.50 to its 52-week high at $6.08 a share. Any high-volume move above $6.08 will then give HNR a chance to tag $7 a share.

Traders can look to buy HNR off weakness to anticipate that breakout and simply use a stop that sits right below its 50-day at $4.20 a share or around $45 a share. One can also buy HNR off strength once it starts to clear those breakout levels with volume and then simply use a stop that sits a comfortable percentage from your entry point.

Gran Tierra Energy


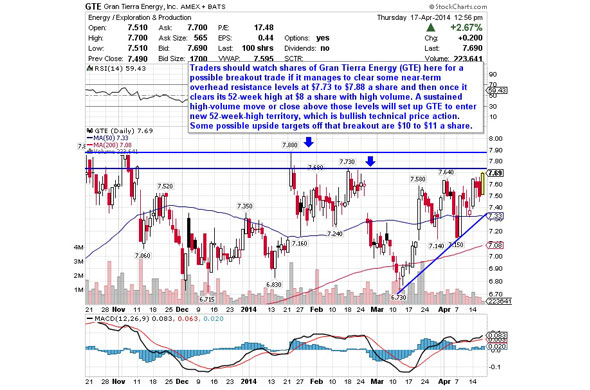
One final under-$10 independent energy player that's starting to trend within range of triggering a big breakout trade is Gran Tierra Energy (GTE), which  is engaged in the acquisition, exploration, development and production of oil and gas properties in Colombia, Argentina, Peru and Brazil. This stock is up a bit so far in 2014, with shares higher by 4.9%.

If you take a look at the chart for Gran Tierra Energy, you'll notice that this stock have been uptrending over the last month and change, with shares moving higher from its low of $6.73 to its intraday high of $7.68 a share. During that move, shares of GTE have been making mostly higher lows and higher highs, which is bullish technical price action. Shares of GTE are starting to break out today above some near-term overhead resistance at $7.64 a share. That move is quickly pushing shares of GTE within range of triggering a much bigger breakout trade.

Traders should now look for long-biased trades in GTE if it manages to break out above some near-term overhead resistance levels at $7.73 to $7.88 a share and then once it clears its 52-week high at $8 a share with high volume. Look for a sustained move or close above those levels with volume that hits near or above its three-month average action of 981,956 shares. If that breakout kicks off soon, then GTE will set up to enter new 52-week-high territory, which is bullish technical price action. Some possible upside targets off that breakout are $10 to $11 a share.

Traders can look to buy GTE off weakness to anticipate that breakout and simply use a stop that sits just below its 50-day at $7.33 or its 200-day at $7.08 a share. One can also buy GTE off strength once it starts to take out those breakout levels with volume and then simply use a stop that sits a comfortable percentage from your entry point.

To see more hot under-$10 equities, check out the Stocks Under $10 Setting Up to Explode portfolio on Stockpickr.

-- Written by Roberto Pedone in Delafield, Wis.


RELATED LINKS:


>>Side-Step the Selling With These 5 Big Trades


>>3 Stocks Spiking on Unusual Volume


>>Want to Buy Apple? Think Again

Follow Stockpickr on Twitter and become a fan on Facebook.

At the time of publication, author had no positions in stocks mentioned.

Roberto Pedone, based out of Delafield, Wis., is an independent trader who focuses on technical analysis for small- and large-cap stocks, options, futures, commodities and currencies. Roberto studied international business at the Milwaukee School of Engineering, and he spent a year overseas studying business in Lubeck, Germany. His work has appeared on financial outlets including

CNBC.com and Forbes.com. You can follow Pedone on Twitter at www.twitter.com/zerosum24 or @zerosum24.


Monday, April 21, 2014

Is Apple Stock Finally in "Screaming Buy" Territory?

A mid-April dip notwithstanding, shares of Apple (NASDAQ: AAPL  ) are now trading below $400 for the first time since December 2011. Though that might not sound that long ago, back then, Apple stock traded for 14.5 times earnings. Today, the stock can be had for 9.5 times earnings: a 35% discount!

In the following video, Fool contributor Brian Stoffel explains that even though Apple doesn't have the same type of sustainable competitive advantages that fellow tech stalwarts Google (NASDAQ: GOOG  ) , Amazon.com (NASDAQ: AMZN  ) , Facebook (NASDAQ: FB  ) , or Microsoft (NASDAQ: MSFT  ) have, Apple shares are worth looking into at today's prices.

Top Oil Service Companies To Buy Right Now

The stage has been set
It's incredible to think just how much of our digital and technological lives are almost entirely shaped and molded by just a handful of companies. Find out "Who Will Win the War Between the 5 Biggest Tech Stocks" in The Motley Fool's latest free report, which details the knock-down, drag-out battle being waged among the five kings of tech. Click here to keep reading.

Saturday, April 19, 2014

4 Stocks Making Big Moves

The following video is from Wednesday's Investor Beat, in which host Chris Hill and analysts Jason Moser and Charly Travers dissect the hardest-hitting investing stories of the day.

Adobe Systems' (NASDAQ: ADBE  )  second-quarter profits fall 66%. Shares of NVIDIA  (NASDAQ: NVDA  ) hit a new 52-week high. Tesla Motors (NASDAQ: TSLA  ) issues its first-ever recall. And Men's Wearhouse (NYSE: MW  ) fires company founder and pitchman George Zimmer. In this installment of Investor Beat, Jason and Charly discuss four stocks making big moves.

NVIDIA was ahead of the curve launching its mobile Tegra processor, but investing gains haven't followed as expected, with the company struggling to gain momentum in the smartphone market. The Motley Fool's brand-new premium report examines NVIDIA's stumbling blocks, but also homes in on opportunities that many investors are overlooking. We'll help you sort fact from fiction to determine whether NVIDIA is a buy at today's prices. Simply click here now to unlock your copy of this comprehensive report.

The relevant video segment can be found between 1:54 and 4:09.

Discover Delivers: 9 Dividend Stocks Increasing Payouts

Google Plus Logo RSS Logo Marc Bastow Popular Posts: PG’s Streak Continues: 6 Dividend Stocks Increasing Payouts Recent Posts: Discover Delivers: 9 Dividend Stocks Increasing Payouts PG’s Streak Continues: 6 Dividend Stocks Increasing Payouts BAC Banks a Raise: 5 Dividend Stocks Raising Payouts View All Posts

Ah, now that’s better. Not only has the weather improved now that spring has (mercifully) arrived, earnings season is bringing out dividend stock increases, too.

IncreasingDividends Discover Delivers: 9 Dividend Stocks Increasing PayoutsLeading the way was financial services and payment processor Discover Financial (DFS), which put a solid dividend increase into the wallets of its shareholders. Here’s a look at the new dividends being paid out to DFS stock holders, along with improvements from other dividend stocks this week. (Note: All dividend yields are as of April 17.)

Rail transportation services provider CSX (CSX) raised its quarterly dividend 6.67% to 16 cents per share.
Payout Date: June 13
Ex-Dividend Date: May 23
CSX Dividend Yield: 2.27%

Bank card services and payments company Discover Financial (DFS) raised its quarterly dividend 20% to 24 cents per share.
Payout Date: May 22
Ex-Dividend Date: May 6
DFS Dividend Yield: 1.69%

Diversified energy services company Oneok (OKE) raised its quarterly dividend 40% to 56 cents per share.
Payout Date: May 15
Ex-Dividend Date: April 28
OKE Dividend Yield: 3.67%

Protective and decorative coatings producer PPG (PPG) raised its quarterly dividend 9.83% to 67 cents per share.
Payout Date: June 12
Ex-Dividend Date: May 8
PPG Dividend Yield: 1.34%

Top Income Companies To Buy Right Now

Industrial and consumer packaging products manufacturer Sonoco (SON) raised its quarterly dividend 3.22% to 32 cents per share.
Payout Date: June 10
Ex-Dividend Date: May 14
SON Dividend Yield: 3.04%

Midstream natural gas and natural liquid gas partnership Targa Resources Corp.  (TRGP) raised its quarterly dividend 6.58% to 64.75 cents per share.
Payout Date: May 16
Ex-Dividend Date: April 24
TRC Dividend Yield: 2.43%

Targa Resources Partners (NGLS) increased its quarterly dividend 2.01% to 76.25 cents per share. With a yield of nearly 5%, NGLS came in with the highest dividend yield for our dividend stocks this week.
Payout Date: May 15
Ex-Dividend Date: April 24
NGLS Dividend Yield: 4.97%

The biggest percentage increase among our dividend stocks this week came from New Jersey-based bank holding company Two Rivers Bancorp (TRCB), which raised its quarterly dividend 50% to 3 cents per share.
Payout Date: May 30
Ex-Dividend Date: May 7
TRCB Dividend Yield: 1.48%

Home appliance manufacturer and distributor Whirlpool (WHR) raised its quarterly dividend 20% to 75 cents per share.
Payout Date: June 15
Ex-Dividend Date: May 14
WHR Dividend Yield: 1.95%

Marc Bastow is an Assistant Editor at InvestorPlace.com. As of this writing he is long CSX. For more dividend stocks increasing payouts, see previous weeks' lists of Companies Increasing Dividends.

Thursday, April 17, 2014

Herbalife and GNC Are Good Investments, Here’s Why

There is a jump of more than 200% since 1970 in the number of Americans who are either obese or overweight, with around 34% of Americans as obese and nearly two-thirds being overweight. A metabolic disorder like diabetes increased 400% in the same period. According to Gary Taubes and Dr. Peter Attia of Nutrition Science, fat-free food labels are only worsening the obesity crisis. They have started causing growing concern in society as well.

Due to the reasons mentioned above, the awareness about keeping healthy and taking proper nutrition is spreading fast among people. Vitamins and supplements are more of a part of the lifestyle nowadays due to which the wellness industry is a flourishing business. GNC Holdings (GNC) and Herbalife (HLF) are popular in the wellness and dietary supplements market.

Looking at GNC

GNC's business is very well diversified and runs through three different segments – retail, franchise and manufacturing/third-party.

GNC has been growing top and bottom lines through strong comparable-store sales growth and is the least controversial of the three companies in this space, and the strong increase in consumer traffic resulted in 8.2% product comps in quarter three. In addition, GNC.com significantly exceeded the industry growth rates and delivered 31.7% comps increase this quarter.

Moreover, GNC offers a dividend that yields 1% that still has a significant room for improvement because the company has ample free cash flow with a payout ratio of 21%. The company has been good at returning money to shareholders through the share repurchase program. GNC has returned far more cash to shareholders than it raised since its IPO in April 2011; its shares have appreciated by a whopping 260% since then.

GNC acquired the UK-based web-only retailer Discount Supplements to boost growth, and expanding in the UK and other European and Scandinavian markets must accelerate growth.

The health and wellness market has been dominated by GNC for over seven decades. It has 8,100 locations in 54 countries worldwide and marvelous brand awareness. These strong reasons make GNC a trusted brand for consumers to fulfill their needs of a healthy lifestyle.

Going forward, GNC targets to maintain the store count growth of approximately 115 net new stores each year and sees potential for opening approximately 5,000 total standalone GNC stores in the U.S.

A Look at Herbalife

The global rise of obesity enabled Herbalife to record net sales of $1.2 billion, 19% above last year's third quarter. However, Herbalife's marketing practice, like all other direct-selling through individual distributors is questionable.

But Herbalife has received good recent endorsements as it won in the Belgian appeals court. The court rejected claims of Herbalife being a pyramid scheme. The court concluded that the income that its distributors earn from others recruited to buy or sell its products isn't in violation of European consumer protection laws.

So, the company looks to be a good investment option with increasing acceptance in Europe and most probably in the U.S. as well. The P/E ratio of 15 indicates that the stock is cheap with a satisfying dividend yield of 1.70%. Analysts are projecting an impressive CAGR of 15% for Herbalife for the next five years.

Conclusion

Both companies have capitalized on people's awareness about leading a healthy lifestyle. While GNC is a well-established name and oldest of the lot, Herbalife has also been making its mark. The growth expectations look promising. But the cheapest is Herbalife and it could make a good addition to your portfolio.

Currently 0.00/512345

Rating: 0.0/5 (0 votes)

Email FeedsSubscribe via Email RSS FeedsSubscribe RSS Comments Please leave your comment:
More GuruFocus Links
Latest Guru Picks Value Strategies
Warren Buffett Portfolio Ben Graham Net-Net
Real Time Picks Buffett-Munger Screener
Aggregated Portfolio Undervalued Predictable
ETFs, Options Low P/S Companies
Insider Trends 10-Year Financials
52-Week Lows Interactive Charts
Model Portfolios DCF Calculator
RSS Feed Monthly Newsletters
The All-In-One Screener Portfolio Tracking Tool
iPhone App MORE GURUFOCUS LINKS
Latest Guru Picks Value Strategies
Warren Buffett Portfolio Ben Graham Net-Net
Real Time Picks Buffett-Munger Screener
Aggregated Portfolio Undervalued Predictable
ETFs, Options Low P/S Companies
Insider Trends 10-Year Financials
52-Week Lows Interactive Charts
Model Portfolios DCF Calculator
RSS Feed Monthly Newsletters
The All-In-One Screener Portfolio Tracking Tool
GNC STOCK PRICE CHART 44.93 (1y: +7%) $(function(){var seriesOptions=[],yAxisOptions=[],name='GNC',display='';Highcharts.setOptions({global:{useUTC:true}});var d=new Date();$current_day=d.getDay();if($current_day==5||$current_day==0||$current_day==6){day=4;}else{day=7;} seriesOptions[0]={id:name,animation:false,color:'#4572A7',lineWidth:1,name:name.toUpperCase()+' stock price',threshold:null,data:[[1366261200000,41.81],[1366347600000,41.75],[1366606800000,41.4],[1366693200000,42.21],[1366779600000,42.98],[1366866000000,43.05],[1366952400000,44.85],[1367211600000,45.5],[1367298000000,45.33],[1367384400000,44.69],[1367470800000,45.47],[1367557200000,45.39],[1367816400000,44.89],[1367902800000,44.81],[1367989200000,45.43],[1368075600000,45.44],[1368162000000,45.98],[1368421200000,45.51],[1368507600000,45.24],[1368594000000,45.59],[1368680400000,45.3],[1368766800000,45.63],[1369026000000,45.3],[1369112400000,45.78],[1369198800000,45.65],[1369285200000,45.53],[1369371600000,45.7],[1369717200000,45.83],[1369803600000,44.75],[1369890000000,45.51],[1369976400000,45.03],[1370235600000,44.44],[1370322000000,43.96],[1370408400000,43.85],[1370494800000,44.1],[1370581200000,44.8],[1370840400000,45.31],[1370926800000,45.83],[1371013200000,45.62],[1371099600000,46],[1371186000000,46],[1371445200000,46.88],[1371531600000,47.93],[1371618000000,47.48],[1371704400000,47.01],[1371790800000,46.71],[1372050000000,45.61],[1372136400000,46.11],[1372222800000,46.55],[1372309200000,45.14],[1372395600000,44.21],[1372654800000,45.29],[1372741200000,45.88],[1372827600000,46.19],[1373000400000,46.7],[1373259600000,46.52],[1373346000000,46.78],[1373432400000,47.29],[1373518800000,47.76],[1373605200000,46.95],[1373864400000,47.02],[1373950800000,47.34],[1374037200000,47.48],[1374123600000,47.24],[1374210000000,47.42],[1374469200000,47.69],[1374555600000,47],[1374642000000,46.64],[1374728400000,51.72],[1374814800000,52.87],[1375074000000,52.97],[1375160400000,52.18],[1375246800000,52.78],[1375333200000,53.38],[1375419600000,54.5],[1375678800000,54.29],[1375765200000,53.47],[1375851600000,52.51],[1375938000000,52.09],[1376024400000,52.56],[1376283600000,53.28],[1376370000000,53.24],[1376456400000,53.04],[1376542800000,52.72],[1376629200000,51.67],[1376888400000,51.57],[1376974800000,51.68],[137706120000! 0,50.77],[1377147600000,51.24],[1377234000000,51.25],[1377493200000,51.37],[1377579600000,50.31],[1377666000000,50.88],[1377752400000,51.52],[1377838800000,50.87],[1378184400000,50.74],[1378270800000,51.08],[1378357200000,52.01],[1378443600000,52.85],[1378702800000,53.46],[1378789200000,53.35],[1378875600000,54.44],[1378962000000,53.02],[1379048400000,52.71],[1379307600000,53.24],[1379394000000,52.9],[1379480400000,52.99],[1379566800000,52.8],[1379653200000,53.32],[1379912400000,53.88],[1379998800000,53.87],[1380085200000,53.73],[1380171600000,54.17],[1380258000000,54.31],[1380517200000,54.63],[1380603600000,55.65],[1380690000000,54.7],[1380776400000,54.27],[1380862800000,55.05],[1381122000000,54.46],[1381208400000,53.61],[1381294800000,53],[1381381200000,54.1],[1381467600000,54.98],[1381726800000,54.68],[1381813200000,54.67],[1381899600000,55.5],[1381986000000,55.6],[1382072400000,55.92],[1382331600000,56.01],[1382418000000,56.13],[1382504400000,57.14],[1382590800000,56.57],[1382677200000,58.9],[1382936400000,59.27],[1383022800000,58.81],[1383109200000,58.59],[1383195600000,58.82],[1383282000000,58.98],[1383544800000,59.05],[1383631200000,59.76],[1383717600000,58.88],[1383804000000,57.61],[1383890400000,57.88],[1384149600000,59.06],[1384236000000,59.7],[1384322400000,59.67],[1384408800000,58.85],[1384495200000,59.63],[1384754400000,59.76],[1384840800000,59.43],[1384927200000,58.15],[1385013600000,58.53],[1385100000000,58.83],[1385359200000,58.25],[1385445600000,58.65],[1385532000000,60.56],[1385704800000,60.18],[1385964000000,59.4],[1386050400000,59.33],[1386136800000,58.98],[1386223200000,58.68],[1386309600000,59.14],[1386568800000,58.16],[1386655200000,57.72],[1386741600000,57.7],[1386828000000,57.93],[1386914400000,58.05],[1387173600000,58.14],[1387260000000,57.77],[1387346400000,58.48],[1387432800000,58.6],[1387519200000,57.51],[1387778400000,57.68],[1387864800000,57.98],[1388037600000,58.28],[1388124000000,57.96],[1388383200000,58.32],[1388469600000,58.45],[1388642400000,57.72],[1388728800000,56.7! ],[138898! 8000000,56.19],[1389074400000,56.64],[1389160800000,57.27],[1389247200000,56.15],[1389333600000,55.76],[1389592800000,54.51],[1389679200000,55.4],[1389765600000,56.12],[1389852000000,54.41],[1389938400000,53.09],[1390284000000,52.55],[1390370400000,53.76],[1390456800000,52.48],[1390543200000,52.24],[1390802400000,51.33],[1390888800000,50.85],[1390975200000,50.09],[1391061600000,50.85],[1391148000000,51.11],[1391407200000,49.02],[1391493600000,50.62],[1391580000000,49.35],[1391666400000,50.69],[1391752800000,51.16],[1392012000000,51.04],[1392098400000,51.89],[1392184800000,52.17],[1392271200000,52.39],[1392357600000,44.72],[1392703200000,44.45],[1392789600000,44.76],[1392876000000,45.57],[1392962400000,46.91],[1393221600000,46.6],[1393308000000,48.37],[1393394400000,48.29],[1393826400000,47.61],[1393912800000,48.23],[1393999200000,48.4],[1394085600000,47.66],[1394172000000,48.22],[1394427600000,48.4],[1394514000000,48.04],[1394600400000,47.62],[1394686800000,46.74],[1394773200000,46.55],[1395032400000,45.24],[1395118800000,44.59],[1395205200000,44.5],[1395291600000,44.25],[1395378000000,44.23],[1395637200000,43.43],[1395723600000,43.52],[1395810000000,43.2],[1395896400000,43.23],[1395982800000,44.13],[1396328400000,45.68],[1396414800000,46.26],[1396501200000,46.64],[1396587600000,45.99],[1396846800000,45],[1396933200000,45.09],[1397019600000,45.89],[1397106000000,44.51],[1397192400000,44.26],[1397451600000,43.92],[1397538000000,44.55],[1397624400000,45.23],[1397710800000,44.93],[1397793538000,44.93],[1397793538000,44.93],[1397746875000,44.93]]};var reporting=$('#reporting');Highcharts.setOptions({lang:{rangeSelectorZoom:""}});var chart=new Highcharts.StockChart({chart:{renderTo:'container_chart',marginRight:20,borderRadius:0,events:{load:function(){var chart=this,axis=chart.xAxis[0],buttons=chart.rangeSelector.buttons;function reset_all_buttons(){$.each(chart.rangeSelector.buttons,function(index,value){value.setState(0);});series=chart.get('GNC');series.remove();} buttons[0].on('click',function(e){chart.showLoading();reset_all_buttons();chart.rangeSelector.buttons[0].setState(2);var extremes=axis.getExtremes();$.getJSON('/modules/chart/price_chart_json.php?symbol=GNC&ser=1d',function(data){if(data!=null){var extremes=axis.getExtremes();axis.setExtremes(data[1][0][0],data[1][data[1].length-1][0]);chart.addSeries({name:'GNC',id:'GNC',color:'#4572A7',data:data[1]});if(data[0][1]>=0){display=data[0][0]+" (1D: +"+data[0][1]+"%)";reporting.html(display);}else{display=data[0][0]+" (1D: "+data[0][1]+"%)";reporting.html(display);} chart.hideLoading();}});})
Wednesday, April 16, 2014

BofA Posts Loss; Wealth Group Profit Slows: Q1 Earnings

Bank of America (BAC) said Wednesday that it lost $276 million in the first quarter of 2014, compared with net income of $1.5 billion a year ago. Revenue (net of interest expense) declined 3% year over year to $22.8 billion.

The company notes that these results include $6.0 billion in litigation expense related to a settlement with the Federal Housing Finance Agency (FHFA) and additional reserves tied to legacy mortgage-related matters.

"The cost of resolving more of our mortgage issues hurt our earnings this quarter,” said CEO Brian Moynihan, in a press release. “But the earnings power of our business and customer strategy generated solid results, and we continued to return excess capital to our shareholders."

Wealth Results

BofA’s Global Wealth and Investment Management unit, which includes Merrill Lynch and U.S. Trust advisors, had revenues of $4.55 billion, up about 3% from the year-ago quarter and a 1.6% improvement from the fourth quarter.

Net income was $729 million, up 1% from a year earlier and down 6% from the earlier quarter. The unit’s return on average allocated capital in the period was 24.74, down from 29.41 a year ago and 30.99 in Q4’13. Its pretax profit margin was 25.6%, down from the prior quarter’s 26.6%.

BofA says asset management fees rose 18% year over year to $1.9 billion. Client balances grew about 1% from the prior quarter and 7% from last year — by about $29 billion — to $2.4 trillion, reflecting about $12 billion in flows and $16 billion in market improvements.

Long-term asset flows for Q1 totaled $17.4 billion versus $9.4 billion a year ago and $20.4 billion in Q4. The level of loan balances, including margin loans, grew 10% year over year to $120 billion, excluding migration.

Mother Merrill

The total level of client assets in Merrill Lynch accounts stood at $1.95 trillion versus $1.92 trillion in the prior quarter and $1.81 trillion a year ago, and the group’s revenue for Q1 was $3.76 billion — compared with $3.70 billion in Q4 ’13 and $3.68 billion in Q1 ’13.

The company says asset management fees totaled about $1.5 billion in the period, up 21% from the year-ago quarter.

The number of financial advisors, though, dropped by 47 to 13,725 for the quarter, primarily driven by continued attrition of  underperforming advisor trainees in its Practice Management Development program.

Advisor productivity, or yearly fees and commissions, were $1.3 million per experienced advisor; total advisor productivity is roughly $1.06 million as of Q1 ’14, up from $1.04 in Q4 ’13 and $971,000 in Q1 ’13.

“As of March, 45% of our advisors had 50% or more of their client assets under a fee-based relationship,” the bank said in a statement.

The company notes that one-third of Merrill revenue comes from brokerage operations, one-third from fee-based business and one-third from net interest income from deposits and credits.

The Merrill Lynch One platform now includes some 98,000 accounts with $32 billion in assets. Some 5,000-plus advisors in five areas of the country have access to it.

“Feedback on the platform is positive with trends in the adoption of investment discipline through the leverage of firm traded models and an increase in [net new assets] in transitioning relationships,” BofA said in a statement. It adds that it is “on track to complete deployment of the new platform by Q3’14 across Merrill Lynch Wealth Management.”

Tuesday, April 15, 2014

Third Point (Dan Loeb) Investor Presentation - Sothebys

Third Point Investor Presentation - Sothebys (BID)

About the author:Canadian Valuehttp://valueinvestorcanada.blogspot.com/
Currently 0.00/512345

Rating: 0.0/5 (0 votes)

Email FeedsSubscribe via Email RSS FeedsSubscribe RSS Comments Please leave your comment:
More GuruFocus Links
Latest Guru Picks Value Strategies
Warren Buffett Portfolio Ben Graham Net-Net
Real Time Picks Buffett-Munger Screener
Aggregated Portfolio Undervalued Predictable
ETFs, Options Low P/S Companies
Insider Trends 10-Year Financials
52-Week Lows Interactive Charts
Model Portfolios DCF Calculator
RSS Feed Monthly Newsletters
The All-In-One Screener Portfolio Tracking Tool
iPhone App MORE GURUFOCUS LINKS
Latest Guru Picks Value Strategies
Warren Buffett Portfolio Ben Graham Net-Net
Real Time Picks Buffett-Munger Screener
Aggregated Portfolio Undervalued Predictable
ETFs, Options Low P/S Companies
Insider Trends 10-Year Financials
52-Week Lows Interactive Charts
Model Portfolios DCF Calculator
RSS Feed Monthly Newsletters
The All-In-One Screener Portfolio Tracking Tool
BID STOCK PRICE CHART 39.32 (1y: +10%) $(function(){var seriesOptions=[],yAxisOptions=[],name='BID',display='';Highcharts.setOptions({global:{useUTC:true}});var d=new Date();$current_day=d.getDay();if($current_day==5||$current_day==0||$current_day==6){day=4;}else{day=7;} seriesOptions[0]={id:name,animation:false,color:'#4572A7',lineWidth:1,name:name.toUpperCase()+' stock price',threshold:null,data:[[1366088400000,35.71],[1366174800000,34.17],[1366261200000,33.03],[1366347600000,33.72],[1366606800000,33.68],[1366693200000,34.58],[1366779600000,34.7],[1366866000000,35.35],[1366952400000,35.15],[1367211600000,35.12],[1367298000000,35.48],[1367384400000,33.69],[1367470800000,34.34],[1367557200000,34.89],[1367816400000,34.75],[1367902800000,34.93],[1367989200000,36.25],[1368075600000,36.31],[1368162000000,36.67],[1368421200000,36.05],[1368507600000,36.52],[1368594000000,35.95],[1368680400000,36.12],[1368766800000,37.12],[1369026000000,36.98],[1369112400000,37.39],[1369198800000,36.15],[1369285200000,36.37],[1369371600000,36.4],[1369717200000,37.23],[1369803600000,37.11],[1369890000000,37.56],[1369976400000,37.25],[1370235600000,37.67],[1370322000000,37.64],[1370408400000,37.85],[1370494800000,38.14],[1370581200000,38.87],[1370840400000,38.87],[1370926800000,38.01],[1371013200000,37.32],[1371099600000,38.05],[1371186000000,38.07],[1371445200000,38.58],[1371531600000,38.36],[1371618000000,38.8],[1371704400000,37.42],[1371790800000,37.41],[1372050000000,37],[1372136400000,37.41],[1372222800000,37.76],[1372309200000,37.95],[1372395600000,37.91],[1372654800000,38.47],[1372741200000,38.81],[1372827600000,39.07],[1373000400000,39.54],[1373259600000,40.1],[1373346000000,40.16],[1373432400000,40.18],[1373518800000,41.14],[1373605200000,41.06],[1373864400000,41.08],[1373950800000,40.57],[1374037200000,40.77],[1374123600000,41.44],[1374210000000,41.26],[1374469200000,41.44],[1374555600000,42.04],[1374642000000,41.83],[1374728400000,42.09],[1374814800000,42.11],[1375074000000,41.95],[1375160400000,43.71],[1375246800000,45],[1375333200000,44.63],[1375419600000,44.8],[1375678800000,45.14],[1375765200000,44.91],[1375851600000,43.36],[1375938000000,43.49],[1376024400000,43.26],[1376283600000,44.13],[1376370000000,44.29],[1376456400000,45.91],[1376542800000,44.73],[1376629200000,45.03],[13768! 88400000,44.47],[1376974800000,45.09],[1377061200000,44.93],[1377147600000,45.36],[1377234000000,45.84],[1377493200000,47.21],[1377579600000,45.96],[1377666000000,46.36],[1377752400000,46.57],[1377838800000,46.11],[1378184400000,46.38],[1378270800000,46.73],[1378357200000,46.89],[1378443600000,46.37],[1378702800000,47.13],[1378789200000,47.4],[1378875600000,48.34],[1378962000000,48.81],[1379048400000,48.57],[1379307600000,46.99],[1379394000000,47.64],[1379480400000,47.6],[1379566800000,47.31],[1379653200000,47.22],[1379912400000,47.57],[1379998800000,48.17],[1380085200000,48.4],[1380171600000,48.47],[1380258000000,48.76],[1380517200000,49.13],[1380603600000,49.71],[1380690000000,50.04],[1380776400000,50.94],[1380862800000,50.77],[1381122000000,50.26],[1381208400000,49.26],[1381294800000,49.14],[1381381200000,50],[1381467600000,50.72],[1381726800000,51.1],[1381813200000,50.45],[1381899600000,51.15],[1381986000000,51.44],[1382072400000,51.9],[1382331600000,52.18],[1382418000000,52.47],[1382504400000,52.58],[1382590800000,52.96],[1382677200000,53.09],[1382936400000,52.75],[1383022800000,53.06],[1383109200000,52.69],[1383195600000,51.9],[1383282000000,52.01],[1383544800000,52.35],[1383631200000,52.67],[1383717600000,51.13],[1383804000000,50.27],[1383890400000,51.41],[1384149600000,51.04],[1384236000000,51.92],[1384322400000,52.46],[1384408800000,50.74],[1384495200000,51.94],[1384754400000,51.74],[1384840800000,51.62],[1384927200000,51.34],[1385013600000,52.67],[1385100000000,52.21],[1385359200000,51.28],[1385445600000,52.22],[1385532000000,51.69],[1385704800000,51.26],[1385964000000,52.22],[1386050400000,51.68],[1386136800000,51.46],[1386223200000,51.55],[1386309600000,51.91],[1386568800000,51.93],[1386655200000,52.21],[1386741600000,51.09],[1386828000000,50.57],[1386914400000,50.4],[1387173600000,50.6],[1387260000000,50.65],[1387346400000,51.21],[1387432800000,50.34],[1387519200000,50.93],[1387778400000,51.12],[1387864800000,51.29],[1388037600000,51.69],[1388124000000,52.22],[1388383200000,52.75],[13884696! 00000,53.! 2],[1388642400000,53.06],[1388728800000,53.51],[1388988000000,52.13],[1389074400000,52.43],[1389160800000,51.96],[1389247200000,51.96],[1389333600000,52.27],[1389592800000,51.51],[1389679200000,52.64],[1389765600000,53.01],[1389852000000,52.66],[1389938400000,53],[1390284000000,51.5],[1390370400000,50.78],[1390456800000,50.47],[1390543200000,48.43],[1390802400000,47.99],[1390888800000,48.88],[1390975200000,48.75],[1391061600000,47.9],[1391148000000,47.92],[1391407200000,46.23],[1391493600000,47.51],[1391580000000,48.01],[1391666400000,49.59],[1391752800000,50.25],[1392012000000,44.58],[1392098400000,45.16],[1392184800000,45.68],[1392271200000,46.8],[1392357600000,46.54],[1392703200000,46.48],[1392789600000,46.68],[1392876000000,47.3],[1392962400000,47.13],[1393221600000,48.45],[1393308000000,48.75],[1393394400000,50.51],[1393826400000,46.72],[1393912800000,47.54],[1393999200000,47.83],[1394085600000,46.93],[1394172000000,48.55],[1394427600000,48.06],[1394514000000,47.27],[1394600400000,46.5],[1394686800000,44.79],[1394773200000,44.73],[1395032400000,44.72],[1395118800000,44.54],[1395205200000,43.56],[1395291600000,43.66],[1395378000000,43.55],[1395637200000,42.86],[1395723600000,43.07],[1395810000000,42.93],[1395896400000,42.59],[1395982800000,43.09],[1396328400000,44.2],[1396414800000,43.82],[1396501200000,43.82],[1396587600000,42.89],[1396846800000,41.39],[1396933200000,42.05],[1397019600000,42.52],[1397106000000,41],[1397192400000,40.14],[1397451600000,40.2],[1397538000000,39.32],[1397621653000,39.32],[1397621653000,39.32],[1397574037000,39.32]]};var reporting=$('#reporting');Highcharts.setOptions({lang:{rangeSelectorZoom:""}});var chart=new Highcharts.StockChart({chart:{renderTo:'container_chart',marginRight:20,borderRadius:0,events:{load:function(){var chart=this,axis=chart.xAxis[0],buttons=chart.rangeSelector.buttons;function reset_all_buttons(){$.each(chart.rangeSelector.buttons,function(index,value){value.setState(0);});series=chart.get('BID');series.remove();} buttons[0].on('click',function(e){chart.showLoading();reset_all_buttons();chart.rangeSelector.buttons[0].setState(2);var extremes=axis.getExtremes();$.getJSON('/modules/chart/price_chart_json.php?symbol=BID&ser=1d',function(data){if(data!=null){var extremes=axis.getExtremes();axis.setExtremes(data[1][0][0],data[1][data[1].length-1][0]);chart.addSeries({name:'BID',id:'BID',color:'#4572A